MSVS Debugging
Did you ever see yourself placing ShowDebug everywhere in the code with comments like Been here, If ok and etc, just for trying to understand why your new groundbreaking feature isn't working correctly? The solution is called breakpoints.
What is debugging?
Simply put, debugging is the ability to put breakpoints in your code and when the server takes that given path it will pause the rest of the execution. This allows you to inspect variable values, evaluate expressions directly on the Immediate Window, and more.
Video
For the visual learners, I've recorded this video. It's using VS2019 but should work with any version.
Setup
- Once you have your solution opened with Visual Studio, open up the Solution Explorer and look for a folder called
server-components. - Then you right click the
map-serverand selectSet as Startup Project. - Next you will need to right click the
map-serveronce again and this time open thePropertieswindow. - On the left menu, select
Debugging. Then on the right side panel, underWork Directory, change to$(SolutionDir) - Hit apply, then Ok.
- Compile the solution.
- Now you should be able to separately start your
login-serverandchar-server. - Once these are up, go back to Visual Studio and click the Play button at the top or hit F5 on the keyboard.
- Go to any function in the
map-serversource code and put a breakpoint on any line. Trigger that line of code from the client. - Your client should now be frozen. The Visual Studio window should have taken the focus and you should see the line you selected/highlighted. You can now inspect the variables (go forward with F10, release with F5, and so on).
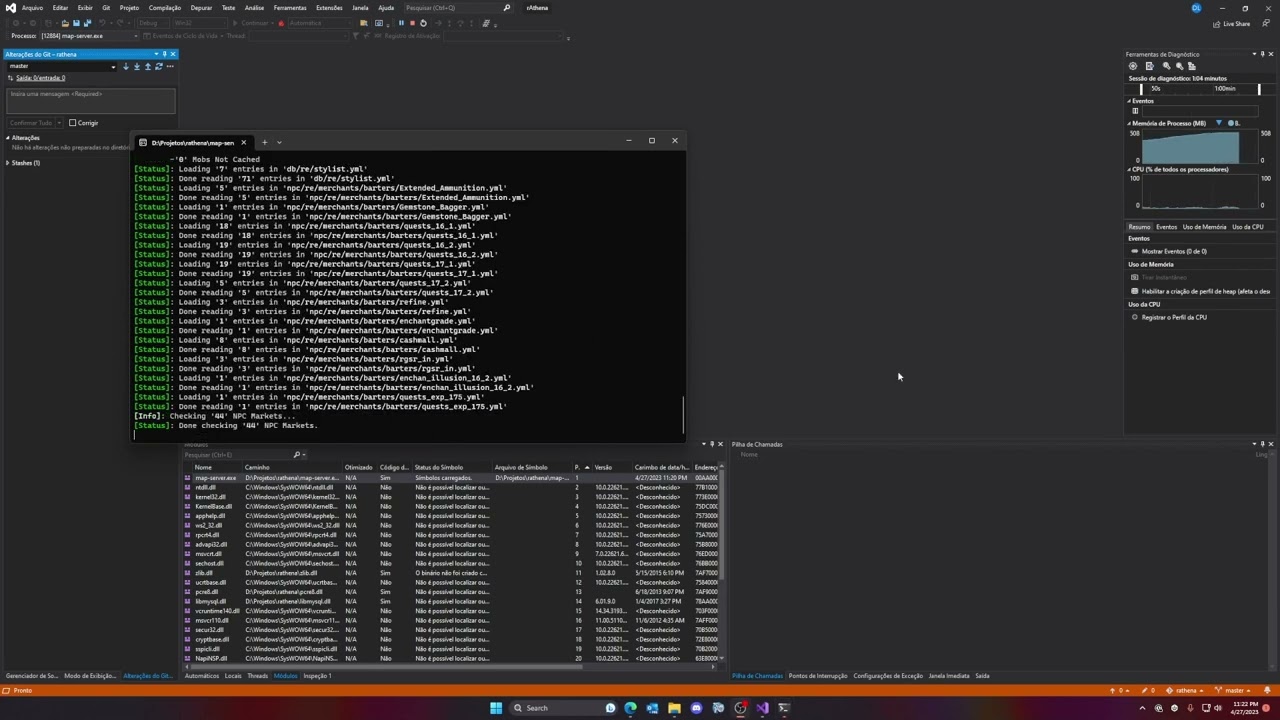
Tracing code path
Many times we need to know how did we end up in a given code path or method. For that we use the IDE to show us all the references to any given variable, method, etc. Sometimes there are so many calls to what we want to trace it becomes difficult to analyse.
This is when breakpoints and the Call Stack window come to place.
Once your code is stopped at any breakpoint, you should see at the bottom a window called Call Stack. Those items in the list are from top to bottom, the order of execution the code has taken until the line you put a breakpoint.
Taking breakpoints a bit further
Using breakpoints sometimes can cause some harm, for instance, when you're debugging something that happens very quickly and in rapid succession. You'll have no time of ALT-Tab'ing back and forth between server and client because the server will be always paused on the breakpoint.
In that case, you can right-click on a breakpoint and select either Conditions... or Actions....
- Conditions
You can choose a condition to trigger the breakpoint. Let's say you want it to stop only when a certain skill is triggered, just put the evaluation there. Eg:md->skillid == 1234. Note: this is extremely slow. - Actions
Instead of actually pausing the execution you can use this to execute a piece of code whenever a breakpoint is hit. Rather than having to recompile to add a simple log, you can use this to add logs at will without the impact of the Conditional Breakpoints. In order for the breakpoint not stop the code execution you will need to tick the checkbox right below the text field, something likeContinue code execution.
Anything missing?
Should you have any questions, don't hesitate to ask questions at our Discord. We'll be happy to help.